Mada za sehemu hiiStatisticsMada 8
Frequency Polygons
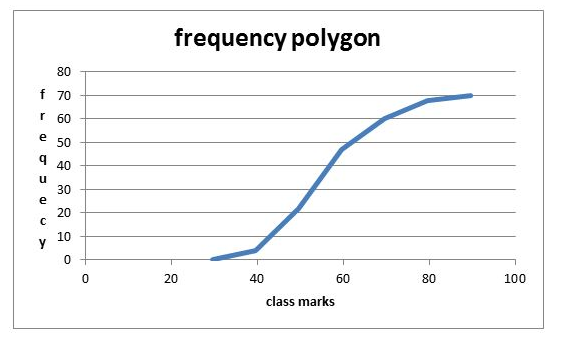
This is a graph made by joining the middle-top points of the columns of a frequency histogram. Drawing Frequency Polygons from Frequency Distribution Tables
For example; use the frequency distribution table below to draw a frequency polygon.
| Class Interval | Class Mark | Frequency |
|---|---|---|
| 25 - 29 | 27 | 6 |
| 30 - 34 | 32 | 12 |
| 35 - 39 | 37 | 10 |
| 40 - 44 | 42 | 16 |
| 45 - 49 | 47 | 20 |
| 50 - 54 | 52 | 14 |
| 55 - 59 | 57 | 16 |
| 60 - 64 | 62 | 18 |
| 65 - 69 | 67 | 8 |
| 70 - 74 | 72 | 4 |
Solution
In a frequency polygon, one interval is added below the lowest interval and another interval is added above the highest interval and they are both assigned zero frequency. The points showing the frequency of each class mark are placed directly over the class marks of each class interval. The points are then joined with straight lines.
Interpretation of frequency polygons
The frequency polygon below represents the heights, in inches, of a group of professional basketball players. Use the frequency polygon to answer the following questions:
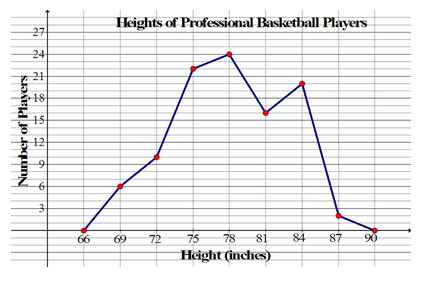
The number of players whose heights were measured 100.
Mwalimu
Unasoma somo hili? Niulize nikuelezee chochote kilichomo.
Ingia ili kumuuliza Mwalimu wa AI wa Sonza kuhusu mada hii.
Ingia ili kuulizaMajadiliano
Hakuna maswali bado